

Sustainability
サステナビリティ
Responding to Climate Change Issues
Our basic view on climate change issues
Strategy
Scenario Analysis
Metrics and targets
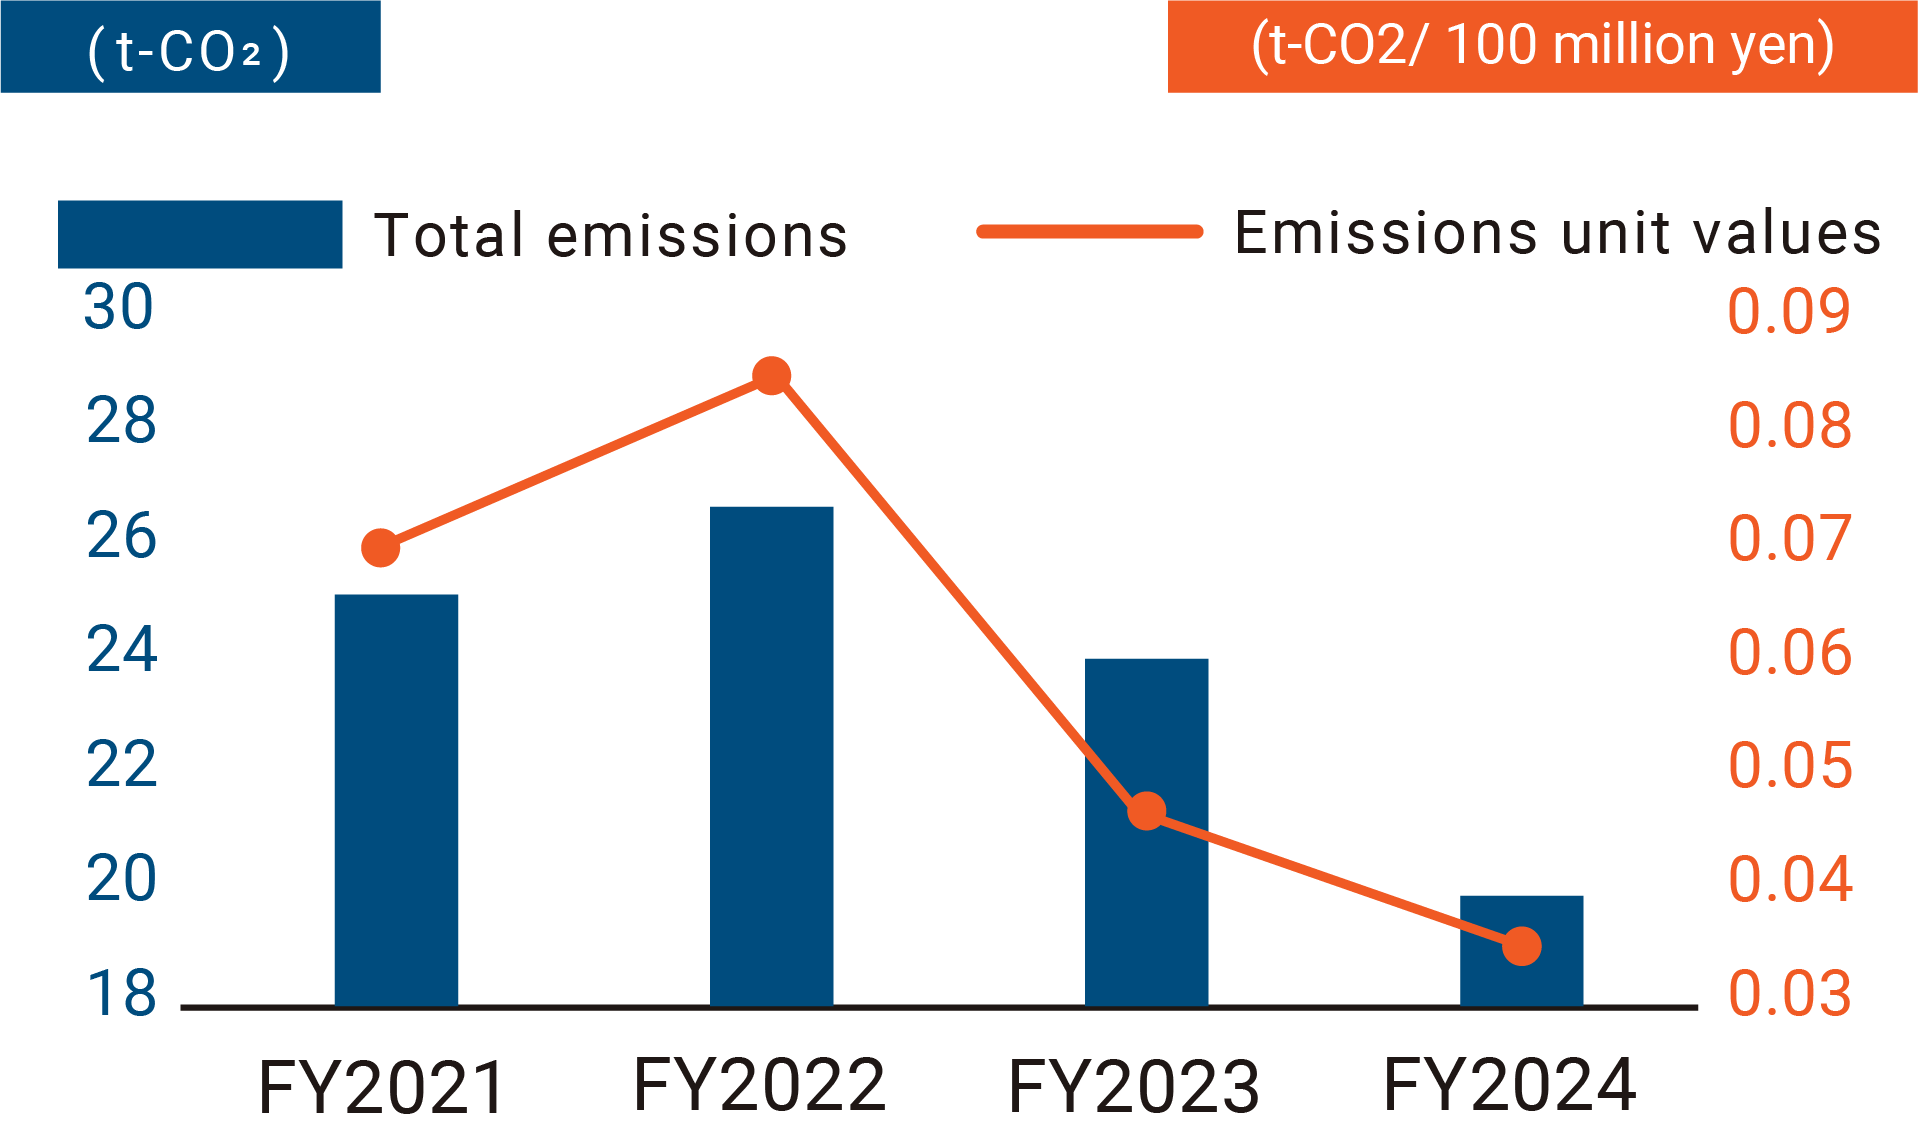
【Scope1】
| Total emissions (t-CO2) |
Emissions unit values | ||
|---|---|---|---|
| (t-CO2/100 million) | FY2021 | ||
| FY2021 | 25.9 | 0.076 | |
| FY2022 | 27.1 | 0.087 | +13.8% |
| FY2023 | 24.7 | 0.048 | ▲37.3% |
| FY2024 | 20.9 | 0.034 | ▲55.9% |
| FY2025 | 13.8 | 0.020 | ▲73.6% |
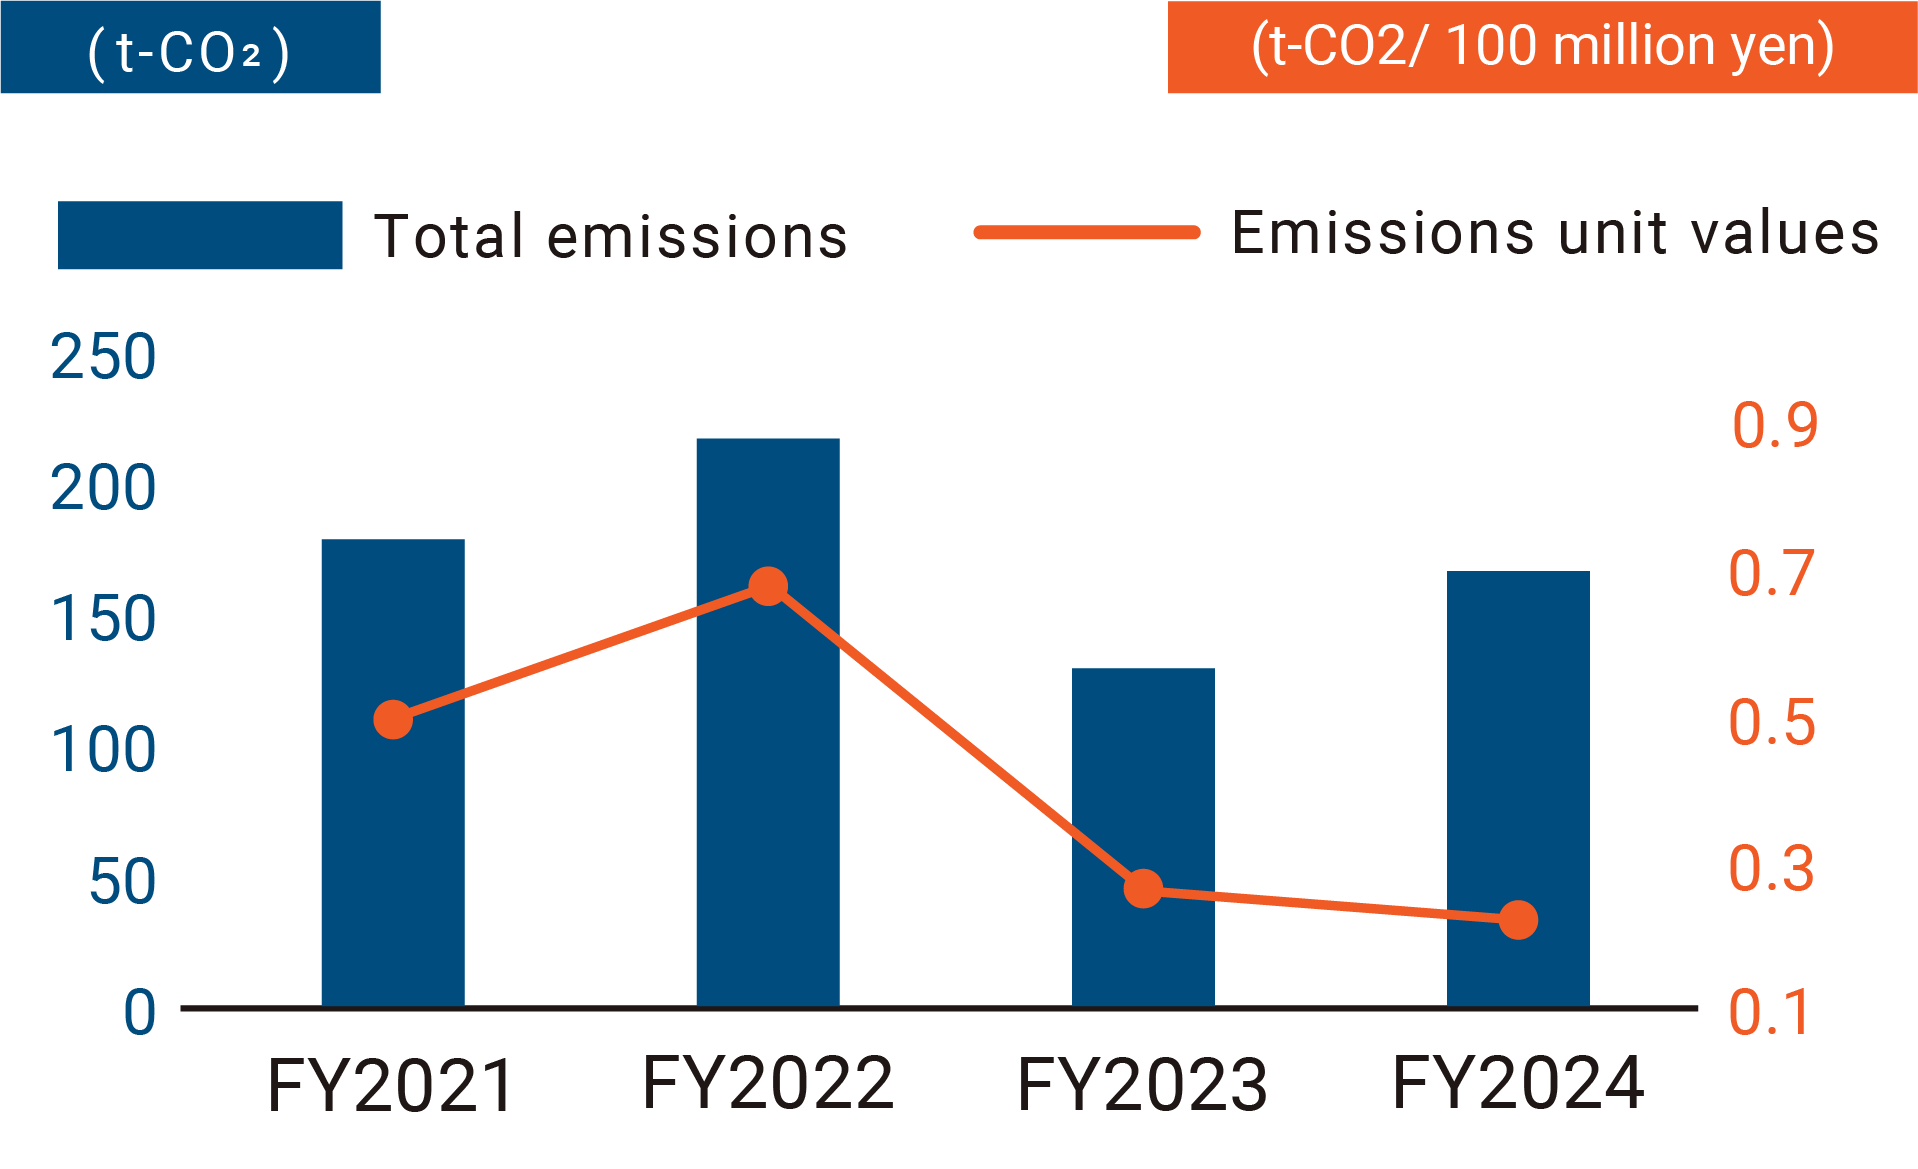
【Scope2】
| Total emissions(t-CO2) | Emissions unit values | ||
|---|---|---|---|
| (t-CO2/100 million) | FY2021 | ||
| FY2021 | 166.8 | 0.491 | |
| FY2022 | 215.5 | 0.690 | +40.5% |
| FY2023 | 145.9 | 0.282 | ▲42.5% |
| FY2024 | 153.1 | 0.246 | ▲49.9% |
| FY2025 | 158.7 | 0.232 | ▲52.7% |
【Scope3】
| FY2023 Emissions(t-CO2) |
FY2024 | FY2025 | |||||
|---|---|---|---|---|---|---|---|
| Emissions(t-CO2) | Year on Year | Emissions(t-CO2) | Year on Year | ||||
| Category1 | Purchased goods and services | 6,854.3 | 7,703.7 | +12.4% | 8,475.8 | +10.0% | |
| Category2 | Capital goods | 537.2 | 176.6 | ▲67.1% | 5,228.5 | +2,860.0% | |
| Category3 | Fuel- and energy-related activities | 37.7 | 35.9 | ▲4.8% | 31.9 | ▲11.3% | |
| Category4 | Upstream transportation and distribution | 25.9 | 22.7 | ▲12.5% | 23.5 | +3.6% | |
| Category5 | Waste generated in operations | 940.1 | 777.0 | ▲17.4% | 819.9 | +5.5% | |
| Category6 | Business travel | 38.5 | 51.0 | +32.5% | 58.5 | +14.8% | |
| Category7 | Employee commuting | 115.9 | 151.9 | +31.0% | 161.7 | +6.5% | |
| Category8 | Upstream leased assets | - | - | - | - | - | |
| Category9 | Downstream transportation and distribution | - | - | - | - | - | |
| Category10 | Processing of sold products | - | - | - | - | - | |
| Category11 | Use of sold products | 44,450.6 | 40,224.0 | ▲9.5% | 45,986.7 | +14.3% | |
| Category12 | End-of-life treatment of sold products | 1,842.6 | 1,861.3 | +1.0% | 2,038.9 | +9.5% | |
| Category13 | Downstream leased assets | 3,229.6 | 2,595.0 | ▲19.7% | 2,838.6 | +9.4% | |
| Category14 | Franchises | - | - | - | - | - | |
| Category15 | Investments | - | - | - | - | - | |
| Total | 58,072.4 | 53,599.0 | ▲7.7% | 65,664.0 | +22.5% | ||